Creating a report
In this section, we'll create an Excel report that displays the historical records of pumps speed .
1. From Stream Explorer, Select Reports
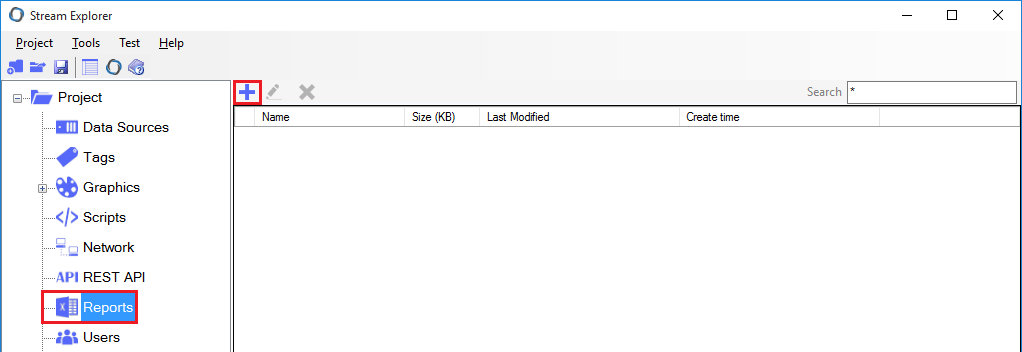
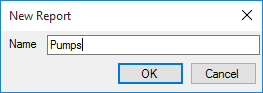
2. In New Report window, Enter the name "Pumps".
3. Double-click on the report named "Pumps" to Open Excel and start editing the report.
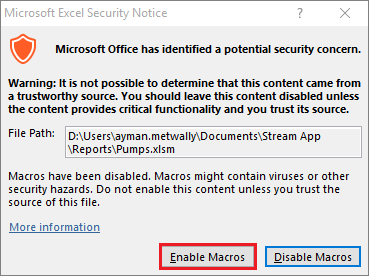
If the following message appears, click on "Enable Macros" so that the internal VBA scripts runs and successfully accesses Stream SCADA 4.1.1.0 API.
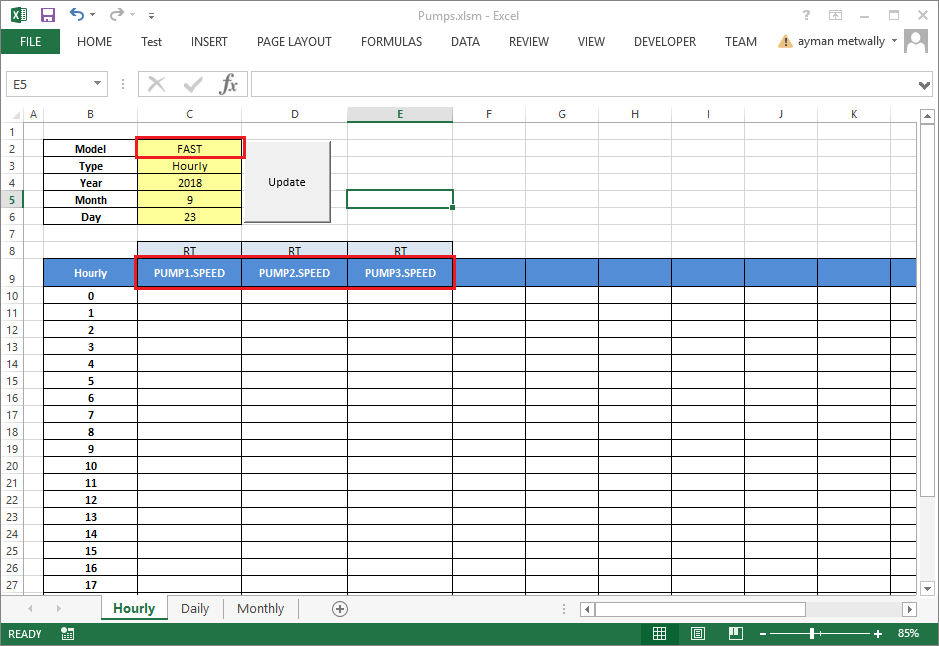
3. In the report, notice and edit the following:
- Model: FAST (This is the historical model that we used to store pumps speed).
- Tag names row: Write PUMP1.SPEED, PUMP2.SPEED and PUMP3.SPEED.
By finishing this step, the design phase has been finished and the report is ready for operators to fetch data.
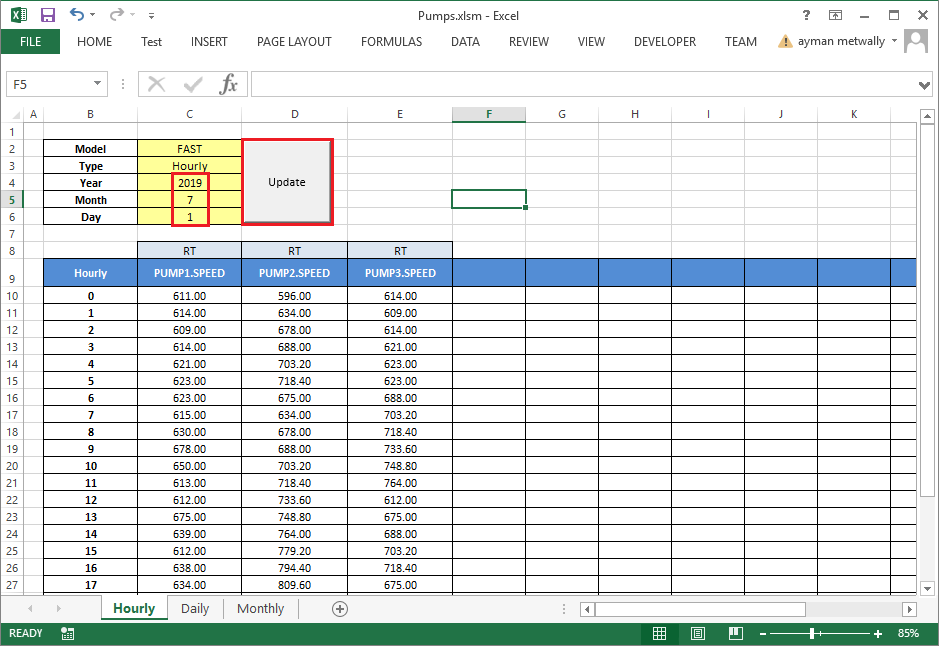
4. To run the report (start fetching data), follow the following:
- Select the proper date (Year, Month and Day).
- Click Update button.
Similar steps can be followed in Daily and Monthly reports.
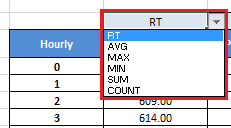
5. You can choose what type of data aggregation using the combo box above each tag name.