Trend Viewer
In order to add a Trend Viewer to the graphics page, follow the following steps:
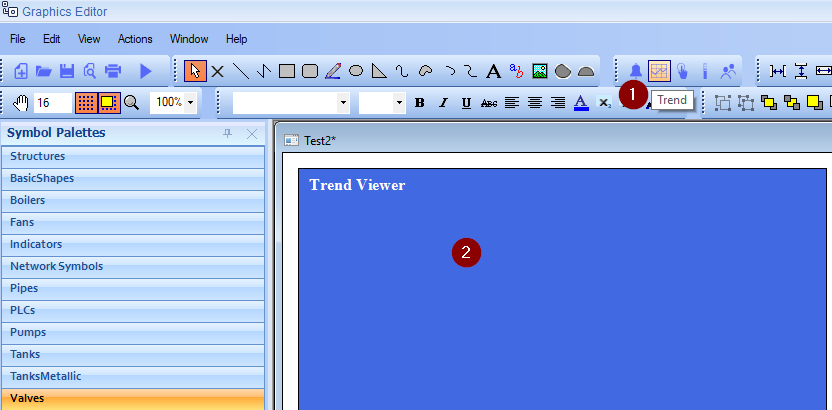
1. Select "Trend Viewer" component from the tool bar.
2. To configure the "Trend Viewer", Double-click to open its configuration window.
Trend Viewer Configuration
General Tab
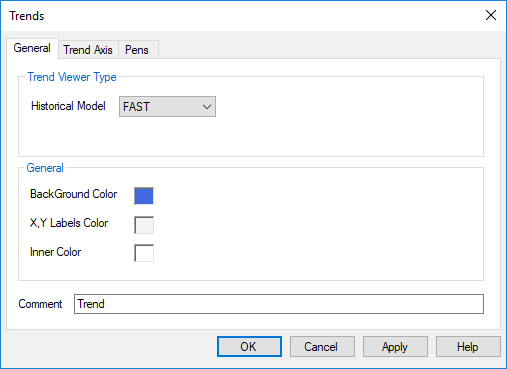
Trend Viewer Type
- Historical Model: Select the default "Historical Model" that will be source of the historical data for the trend.
General
- Background Color: Set the color of the background of the Trend Viewer. Consider using a color that is appropriate with pens colors.
- X,Y Labels Color: Set the color of the text color of X and Y labels.
- Inner Color: Set the color of the inner area of the Trend Viewer.
- Comment: Optional user information.
Trend Axis
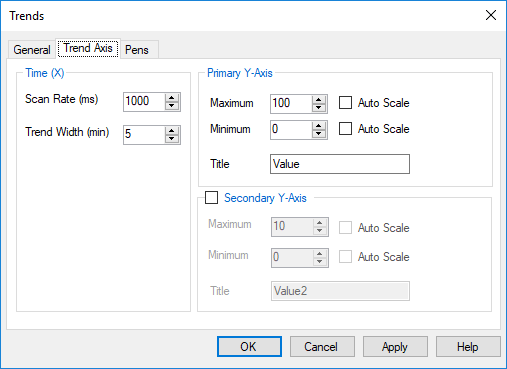
Time (X)
- Scan Rate (ms): Sets the frequency of plotting new point in the real time chart.
- Trend Width (min): Sets the total width of the visible trend area at any time.
Primary Y-Axis
- Maximum and Minimum: Set the max and min value of the primary Y-axis.
- Auto Scale: Set this option if you need the value of the max or min to scale automatically (auto adjust based on the real time value).
Secondary Y-Axis
The secondary Y-Axis is optional. When this option is selected, any pen can be assigned to either the primary or the secondary axis.
Like the primary axis, same options can be set for the secondary axis.
Note: Consider using the secondary Y axis when plotting pens that have big difference in their full ranges. For example, plotting delta-p with level values.
Pens
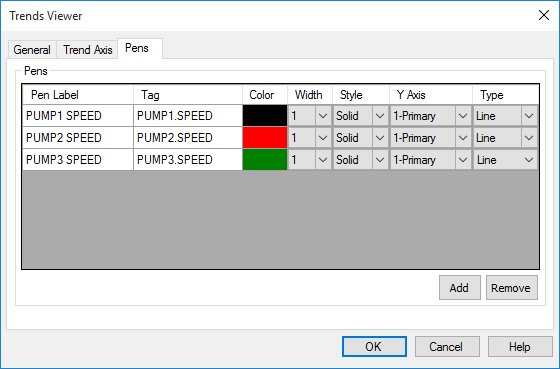
Pens
Add here as many as required pens. For each pen, you can assign the following:
- Pen Label: Add here a label that will be shown in the legend. (No restrictions).
- Tag: Add here the actual tag name to be plotted. Double-click inside this field to open Tags Browser.
- Color: Pen color.
- Width: Pen width.
- Pen Style: Pen line style (Dash, Dot .. etc).
- Y Axis: Assign either the primary or the secondary axis (if enabled).
- Type: Select pen type: Line, Fast Line, Point, Fast Point, Bubble and Column.
Note: Selecting Fast Line or Fast Point means that "Anti-Aliasing" mode is not active (Highest possible graphics is not active). Select these options to disable for better performance if the trend viewer will be designed to show large number of points.