Create Graphics
In this section, we'll create a graphical page that shows information about our defined pump.
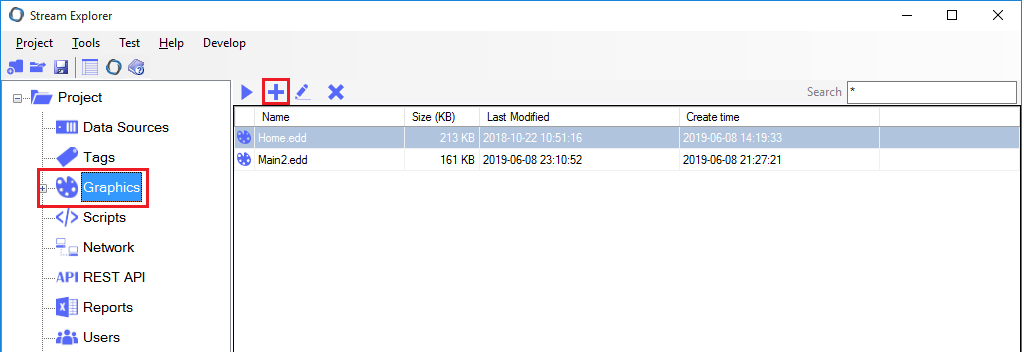
1. From Stream Explorer, Select Graphics
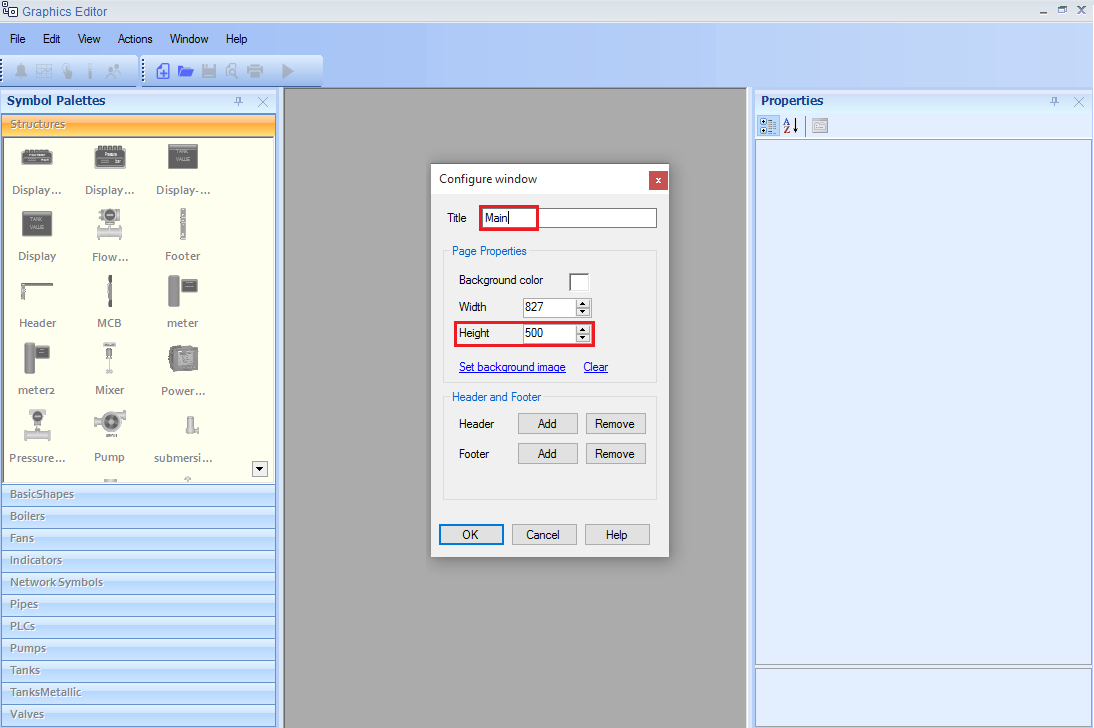
2. Graphics Editor will open, creating a new window. Enter the following details:
- Title: Main
- Width: Leave it to its default.
- Height: 500
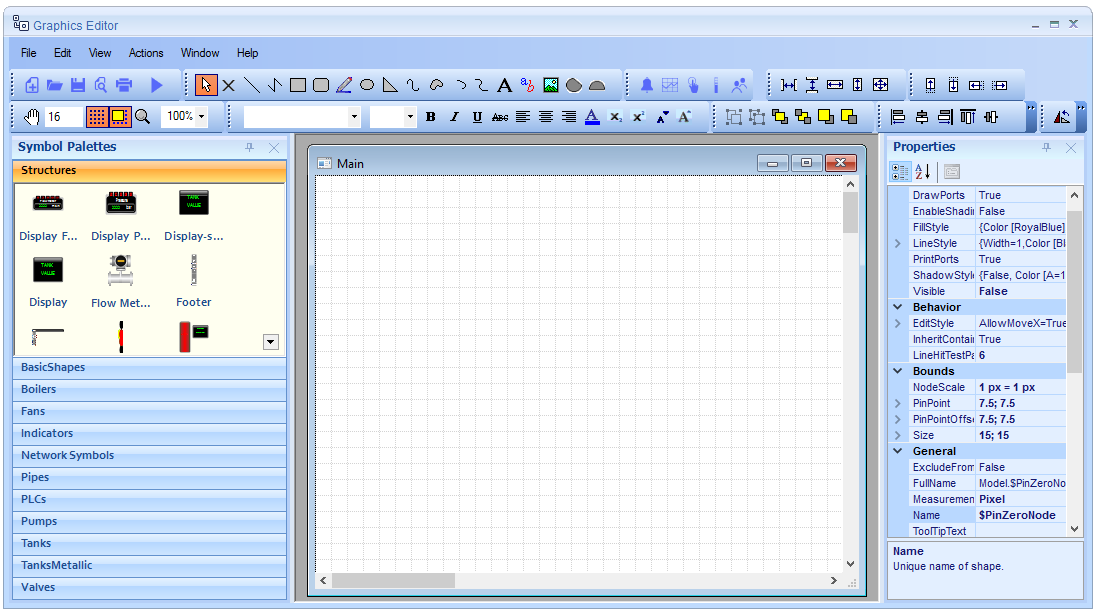
3. A blank window will appear. This is the drawing area for the graphics.
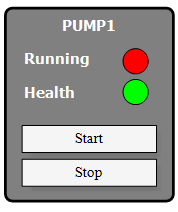
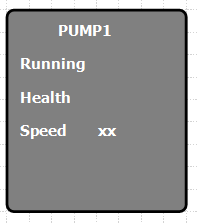
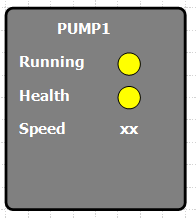
4. We'll create a pump plate that shows pump information. The final output should like the following:
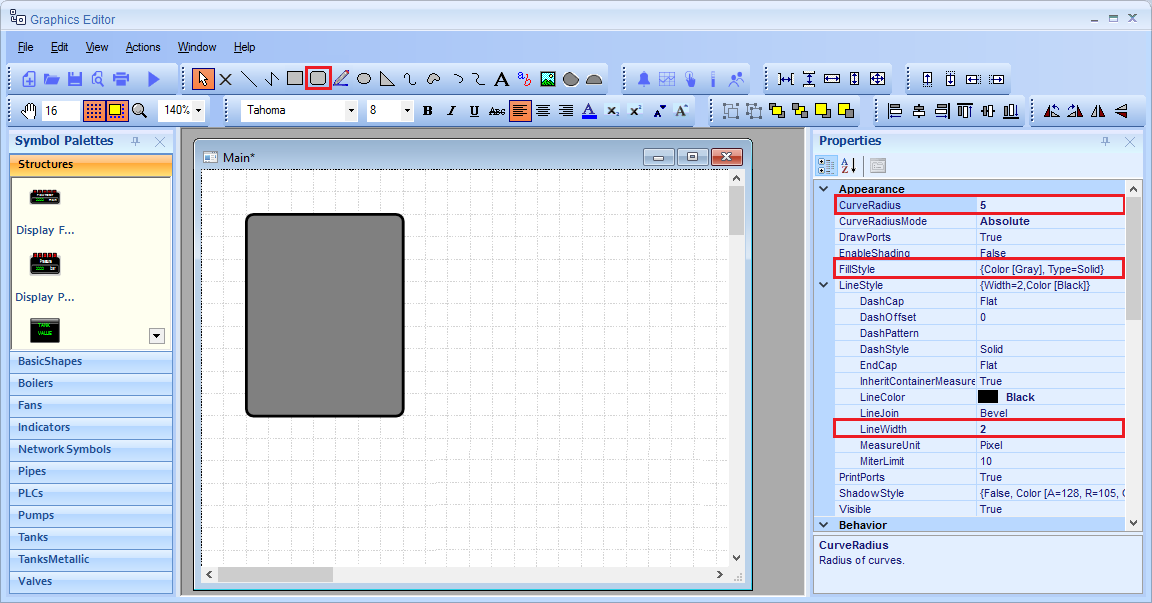
5. Draw a round rectangle
Set its properties as the following:
- CurveRadious: 5
- Fill Style: Gray (Click on the icon
 to open the color editor)
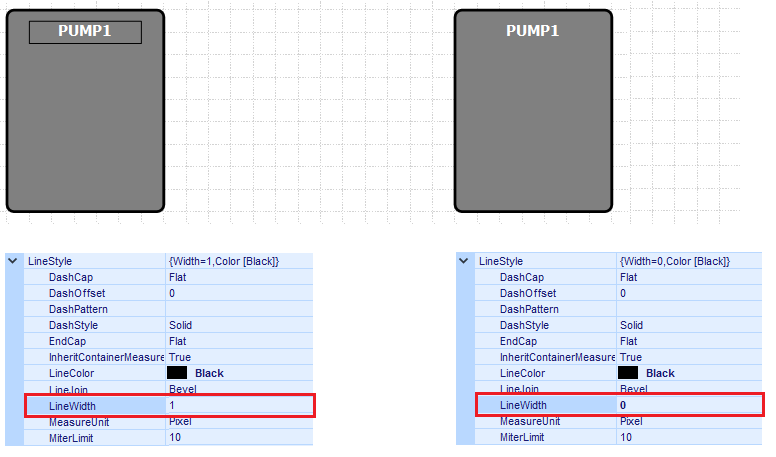
 - LineStyle \ LineWidth: 2
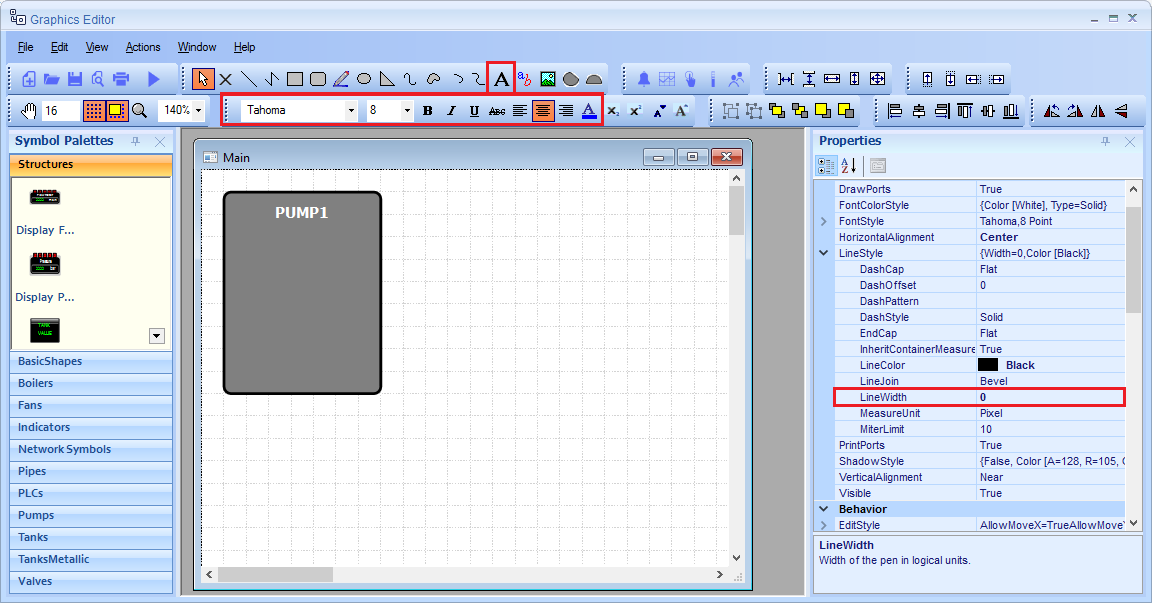
5. Draw a Text box from the tool bar
Set its properties as the following:
- Font: Tahoma
- Bold: True
- Align Text: Center Text
- LineStyle \ LineWidth: 0 (Zero means no border at all).
Note 1: To remove the border from any Text box, set its LineWidth to Zero.
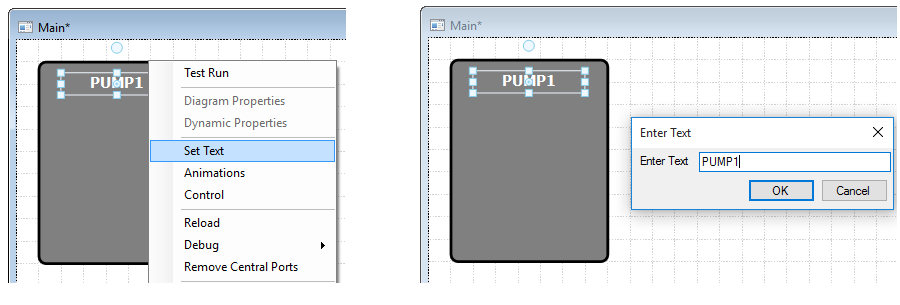
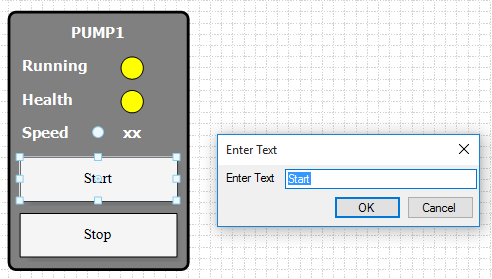
Note 2: To change the text of any object:
Right-Click on the object and select Set Text. Enter the new text and click OK.
6. Duplicate this text box as the following (either by Copy & Paste or by dragging the text node while pressing Ctrl button).
7. Add two circles from the tool bar
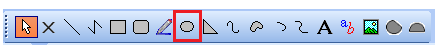
8. Add two buttons from the tool bar

Right-Click on each button and click on Set Text to change their texts as Start and Stop.
Don't forget to save your work from time to time (with by Ctrl+S or the save icon  )
)
9. Tips for precise drawings
a. While working with graphics, you may need to adjust the drawing area from this tool bar:

You can do the following:
- Change zoom level (Also can be changed by holding Ctrl and turning mouse-wheel)
- Enable or Disable snapping objects to the grid.
- Change grid size
b. Tools to align, rotate and order objects
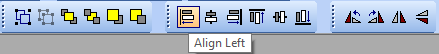
Place the mouse over any icon to know what function does it provide.
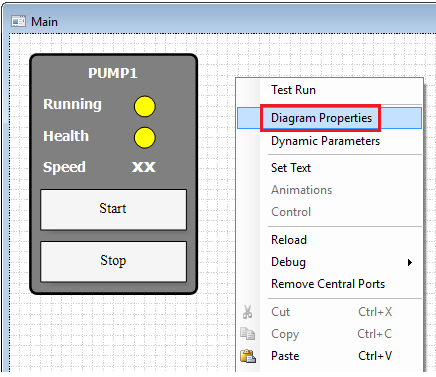
10. Note: At anytime, you can edit page width, height and other properties by doing the following:
- Right-Click on the drawing area of the page.
- Click on Diagram Properties.
11.