Radar Chart
1. Overview
The Radar Chart component is a sophisticated data visualization tool designed for the Stream platform dashboard. It displays multivariate data in a two-dimensional chart format where multiple quantitative variables are represented on axes radiating from a central point.
This component is particularly effective for:
- Performance Analysis: Comparing system metrics across multiple dimensions
- Quality Control: Visualizing multi-parameter quality assessments
- Process Monitoring: Displaying industrial process parameters
- Comparative Analysis: Side-by-side comparison of multiple datasets
- KPI Dashboards: Presenting key performance indicators in a unified view
Key Features
- Multi-Dataset Support: Each pen represents a separate dataset with customizable styling
- Semicolon-Separated Configuration: Simple string-based configuration for labels and tags
- Dynamic Select Integration: Runtime switching between different data sources
- Real-Time Updates: Live data streaming from PLC/SCADA systems
- Customizable Appearance: Full control over colors, styling, and layout
- Responsive Design: Adapts to different screen sizes and panel dimensions
2. Configuration Steps
2.1 Panel Configuration
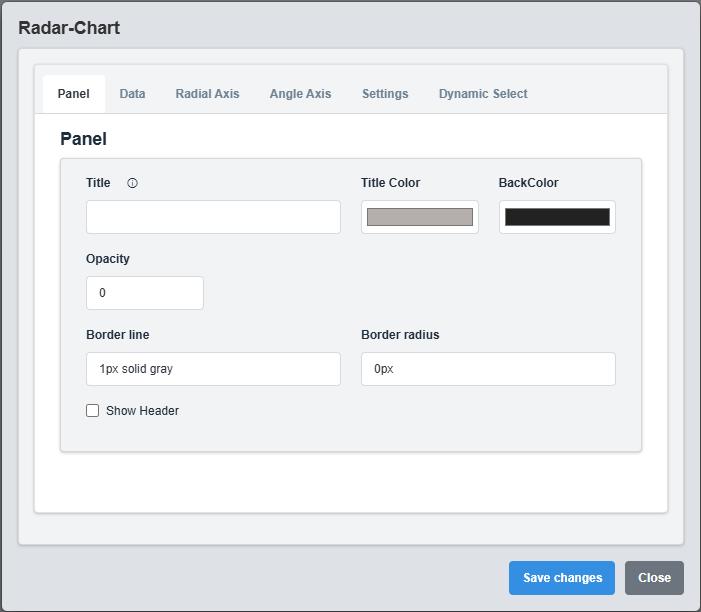
Panel Configuration tab showing basic appearance and layout settings for the radar chart component.
The Panel tab controls the basic appearance and layout of the radar chart component.
|
Parameter |
Description |
Format/Options |
Example |
|
Title |
Sets the display title for the chart panel |
Text string with optional Dynamic Select placeholders |
"System Performance - @{LABEL}" |
|
Title Color |
Defines the color of the chart title text |
Hex color code or CSS color name |
#b6adad |
|
Back Color |
Sets the background color for the entire chart panel |
Hex color code or CSS color name |
#222222 |
|
Opacity |
Controls the transparency level of the panel background |
0.0 (transparent) to 1.0 (opaque) |
1.0 |
|
Border Line |
Defines the border style for the container. Supports both full border and side-specific border styling |
CSS border syntax or side-specific syntax (semicolon-separated) |
1px solid gray |
|
Border Radius |
Sets the corner rounding for the panel |
CSS border-radius value |
0px |
|
Show Header |
Toggles the display of the panel header |
Checked/Unchecked |
Unchecked |
Note: The @{LABEL} , @{Value} placeholder in the Title field will be automatically replaced with the selected Dynamic Select label when Dynamic Select is configured and active.
2.2 Data Configuration
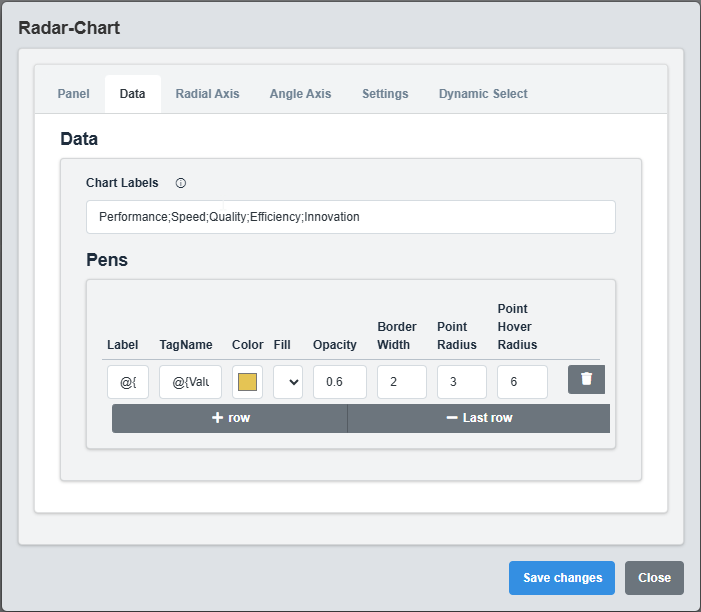
Data Configuration tab showing settings for labels and pens (datasets) configuration.
The Data tab is where you configure the actual data sources and labels for the radar chart.
Labels Setup
Configure the chart labels using semicolon-separated values:
Example: "Performance;Speed;Quality;Efficiency;Innovation"
Pens Configuration
Each pen represents a separate dataset in the radar chart. You can have multiple pens to compare different data sources.
|
Parameter |
Description |
Format |
Example |
|
Label |
Display name for the dataset in the legend |
Text string with optional Dynamic Select placeholders |
"@{LABEL} Readings" |
|
TagName |
Defines the data source tags for this pen |
Semicolon-separated list of tag names |
"System.performance_Value;System.speed_Value" |
|
Color |
Sets the color for lines, points, and filled areas |
Hex color code |
#E5C454 |
|
Fill |
Determines whether to fill the area under the line |
true/false |
true |
|
Opacity |
Controls the transparency of the filled area |
0.0 to 1.0 |
0.6 |
|
Border Width |
Sets the thickness of the line |
1-10 pixels |
2 |
|
Point Radius |
Sets the size of data points on the chart |
1-10 pixels |
3 |
|
Point Hover Radius |
Sets the size of points when hovering over them |
1-15 pixels |
6 |
2.3 Radial Axis Configuration
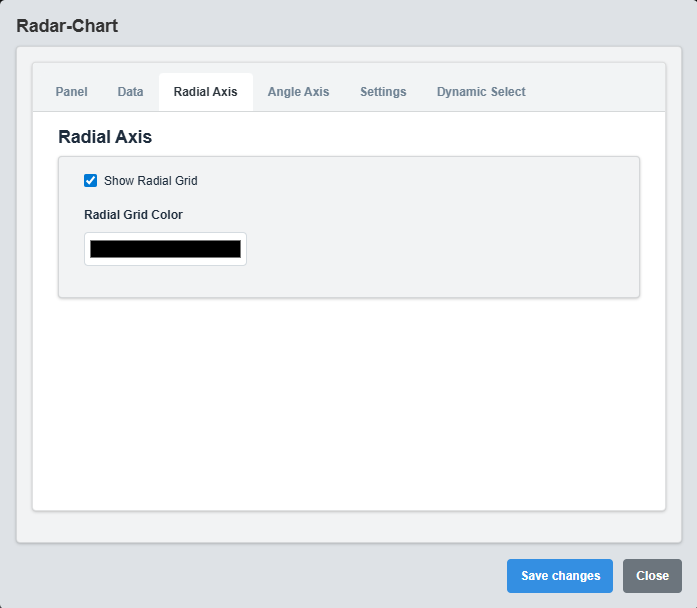
Radial Axis Configuration tab showing settings for radial grid lines that extend from the center to the edges.
Controls the radial grid lines that extend from the center to the edges.
|
Parameter |
Description |
Default |
Example |
|
Show Radial Grid |
Enables or disables radial grid lines |
true |
true |
|
Radial Grid Color |
Sets the color of radial grid lines |
gray |
#808080 |
2.4 Angle Axis Configuration
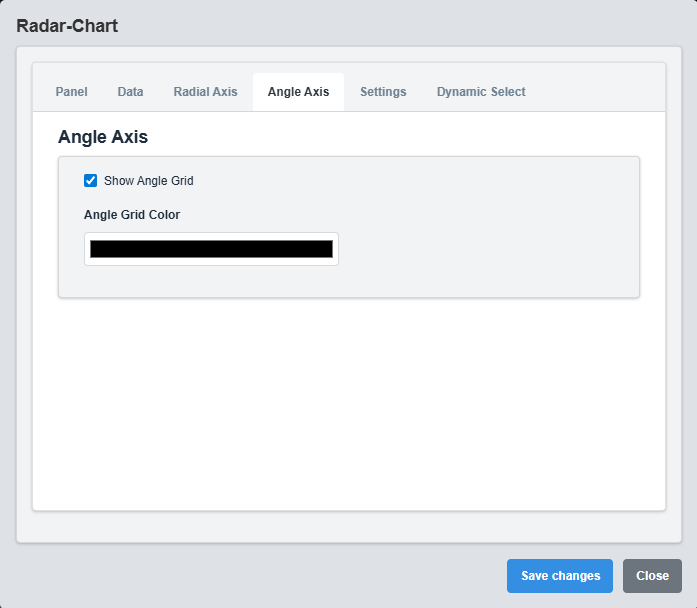
Angle Axis Configuration tab showing settings for angular grid lines that form concentric circles.
Controls the angular grid lines that form concentric circles.
|
Parameter |
Description |
Default |
Example |
|
Show Angle Grid |
Enables or disables angular grid lines |
true |
true |
|
Angle Grid Color |
Sets the color of angular grid lines |
gray |
#808080 |
2.5 Chart Settings

Chart Settings Configuration tab showing general behavior and appearance settings for the chart.
The Settings tab controls the general behavior and appearance of the chart.
|
Parameter |
Description |
Options |
Default |
|
Font Color |
Sets the color for all text elements |
Hex color code or CSS color name |
#ffffff |
|
Start At Zero |
Determines whether the scale starts at zero |
true/false |
true |
|
Show Tooltips |
Enables or disables hover tooltips |
true/false |
true |
|
Show Legend |
Controls the display of the legend |
true/false |
true |
|
Legend Position |
Sets the position of the legend |
top, bottom, left, right |
top |
2.6 Dynamic Select Configuration
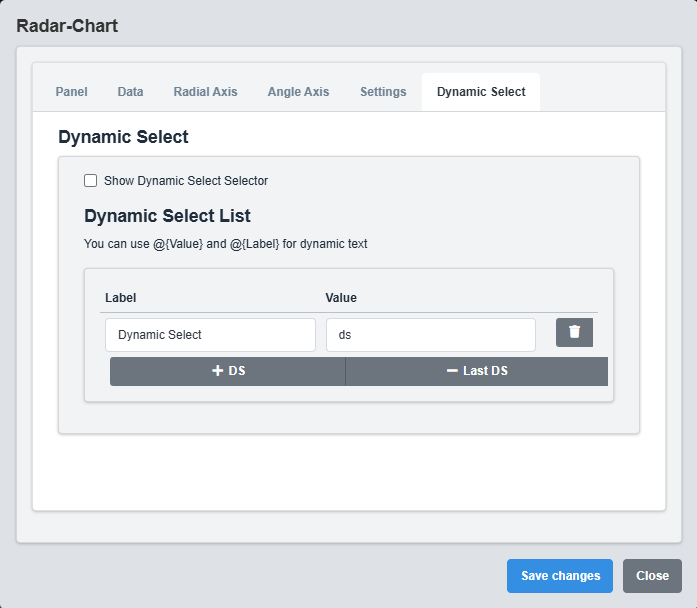
Dynamic Select Configuration tab showing settings for runtime data source switching.
The DS (Dynamic Select) tab enables runtime switching between different data sources.
|
Parameter |
Description |
Default |
Example |
|
Show DS Selector |
Enables or disables the Dynamic Select dropdown |
false |
true |
|
DS List |
Array of available data sources for selection |
Empty array |
See example below |
Dynamic Select Placeholders
- @{Value}: Replaced with the selected DS value
- @{LABEL}: Replaced with the selected DS display label
3. Troubleshooting
Common Issues and Solutions
|
Issue |
Possible Causes |
Solutions |
|
Chart not displaying data |
Incorrect tag names, data source not available, invalid data format |
Verify tag names are correct and data sources are properly configured |
|
Labels not appearing |
Incorrect Labels format, empty Labels string |
Check that Labels string uses semicolon separation and contains valid text |
|
Dynamic Select not working |
DS configuration not properly set up, invalid DSList entries |
Ensure DS configuration is properly set up with valid DSList entries |