Reports
Stream SCADA provides an extensive reporting tool that's based on Excel.
The main key feature of this tool is that you use Excel as the report designer and also the report viewer. With your existing knowledge about Excel, you can build rich and informative reports that serve various needs. Think of all Excel features such formulas, charts, formatting and more ...
The way this report work is that the Excel file is already loaded by VBA scripts that designed by Stream Controls to access Stream runtime server. The Excel (VBA) can access both real time and historical data.
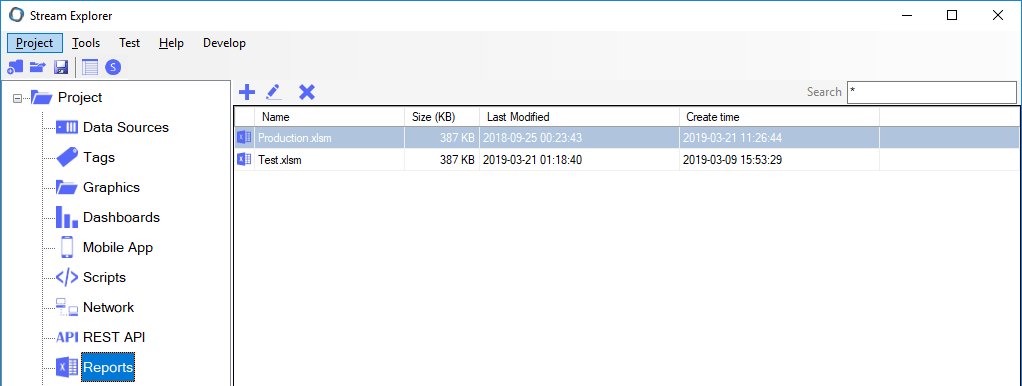
From Stream Explorer, select Reports and click on the Add button.
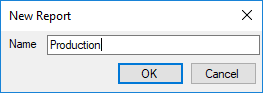
Enter an appropriate file name and press OK. A new report file name will be shown in the grid.
Double-click on the report name, Microsoft Excel will open a specific file template.
The following sheets are available in any Excel report:
Note: Yellow fields indicate that they're modifiable.
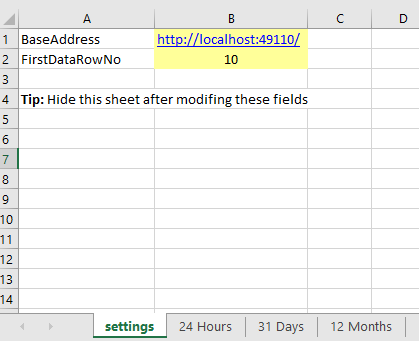
Settings sheet: Contains the following settings:
- BaseAddress: Server address.
- FirstDataRowNo: The first row number that holds report data (default is number 10). Increase to 11 for example if you want to shift the rows by one in the Hourly, Daily or Monthly reports.
24 Hours, 31 Days and 12 Months reports sheets.
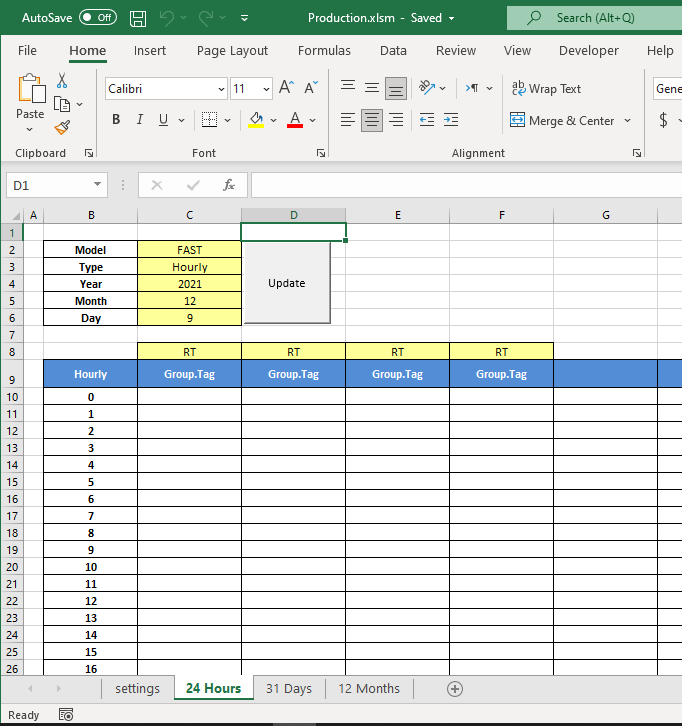
The following fields are modifiable:
- Model: Type here the required historical model that will be the source for this report data
- Type: Hourly, Daily or Monthly
- Year: Enter year number
- Month: Enter month number
- Day: Enter day number
- Aggregation options:
Above each tag name, there's a combo box that allows you to select the proper aggregation method.
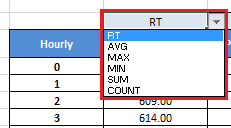
RT: No aggregation (Instantaneous value).
AVG: Calculates the arithmetic mean of all values (within this hour, day or month depending on the report type).
MAX: Obtains the maximum of all values (within the hour, day or month depending on the report type).
MAX: Obtains the minimum of all values (within the hour, day or month depending on the report type).
SUM: Calculates the sum of all values (within the hour, day or month depending on the report type).
Count: Calculate the number of all values (within the hour, day or month depending on the report type).
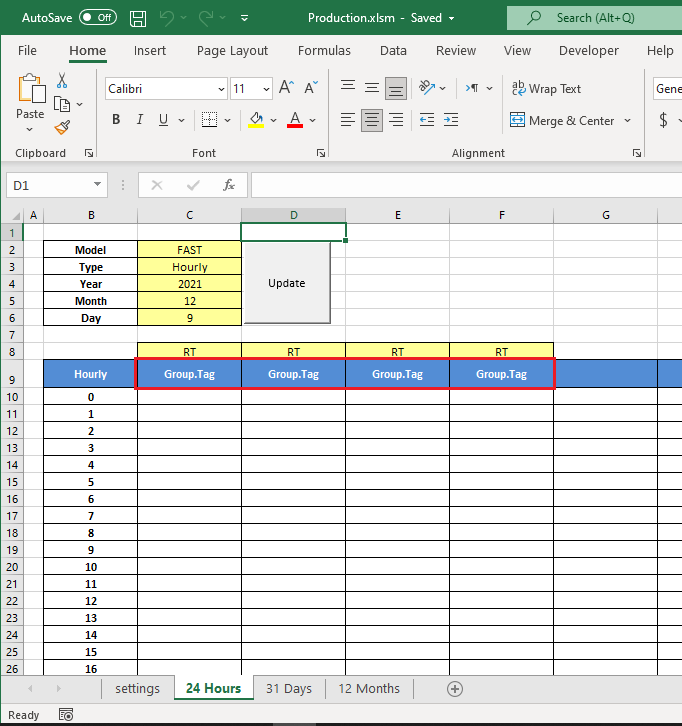
- Tag names row:
In row no 9 (By default): enter the required tag names
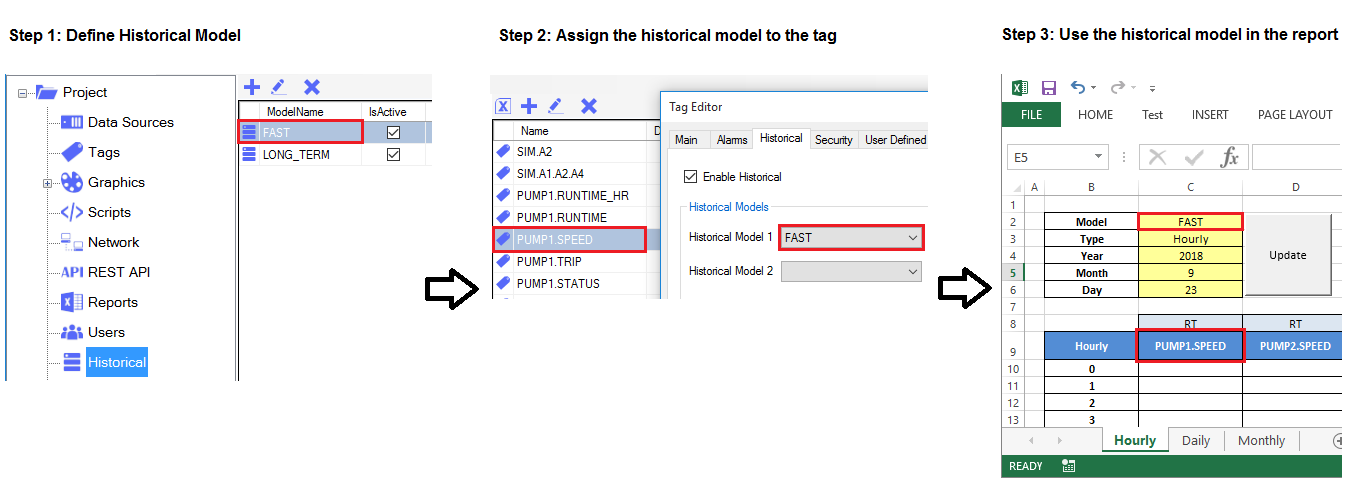
To summarize how reports are designed and linked with Historical, check the below steps: