
Stream Platform for Smart Cities
Utilities, metering, buildings, safety, environment and transport, live on one platform.
- Every city domain on one platformFrom utilities to transport, on the city map
- Multi-tenantMany operators, one platform
- Dashboard builderDrag, drop, bind to live data
- 1M updates per second2M tags on one server

Trusted by


Six domains
The whole city on one platform.
Pick a domain to see its screen and the assets behind it.
Utilities
Power and water networks, district by district.
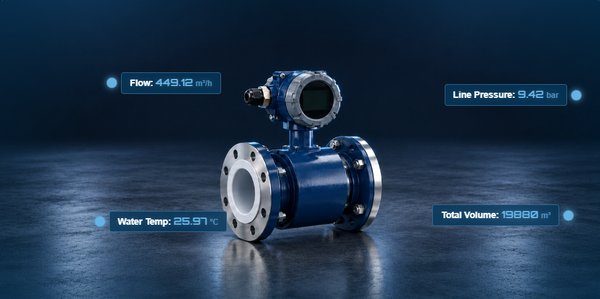
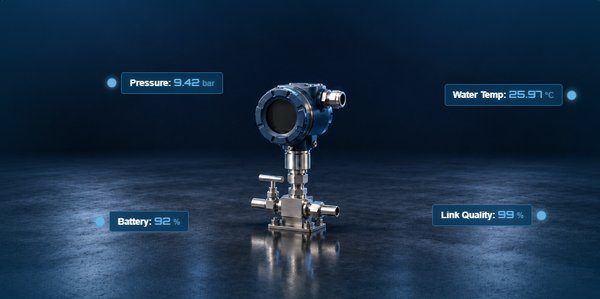
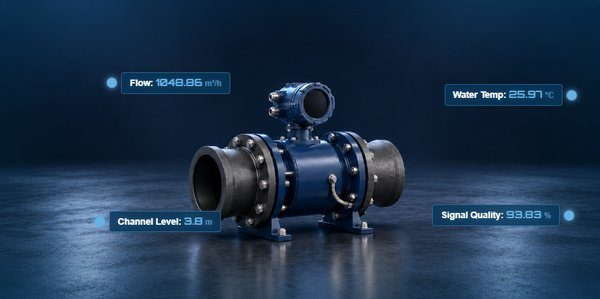
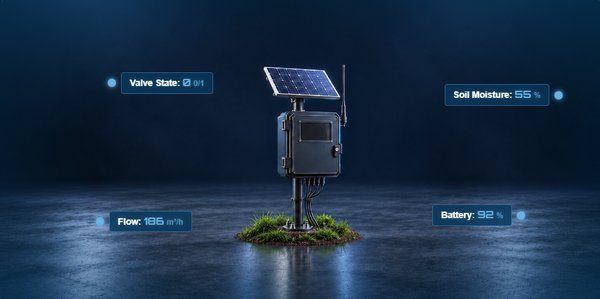
- Network supply and load against capacity
- Each district colored by state: normal, alarm, trip
- Water loss, power factor, outages and pressure
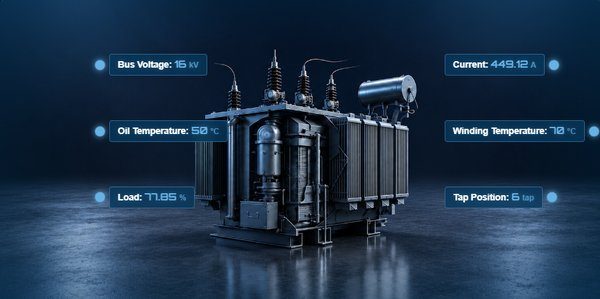
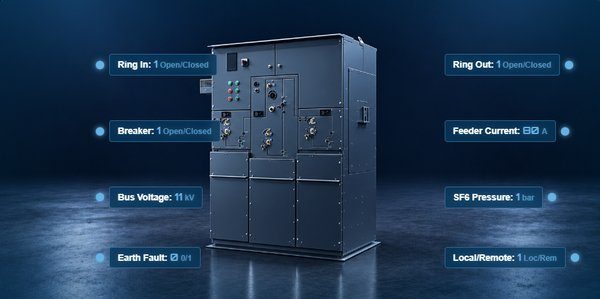
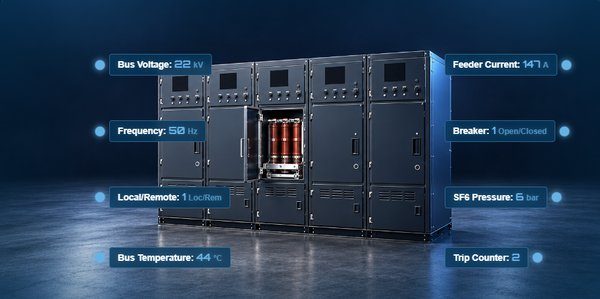
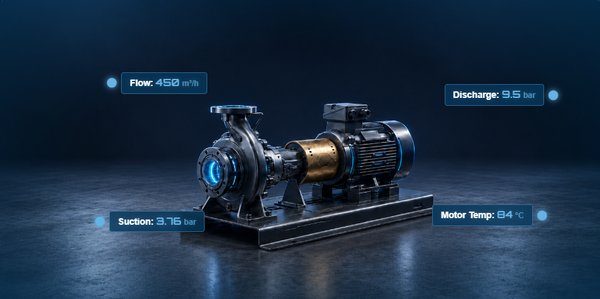
- Kiosks, valve rooms and pump stations, one click away

Asset types
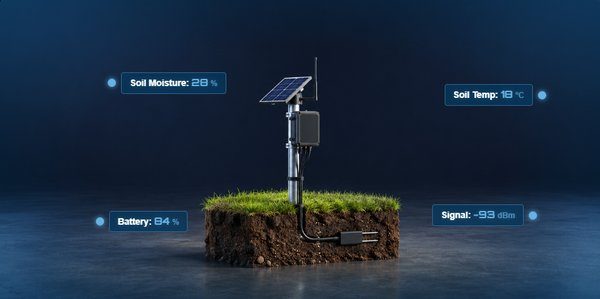


Metering
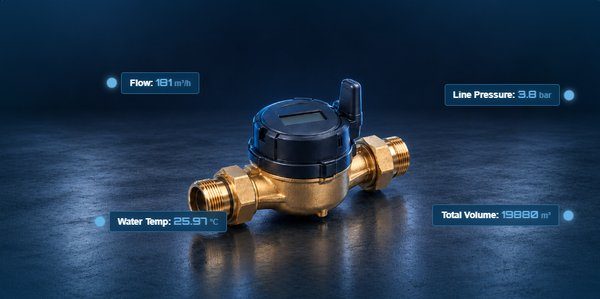
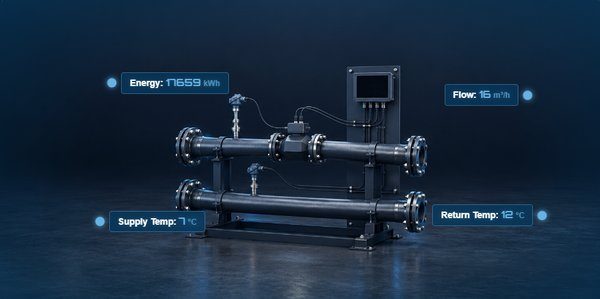
Electricity, water, gas and BTU meters.
- Reads collected today, missing reads, last collection
- Consumption by day and by district
- Meter alerts: tamper, leak, battery low, reverse flow
- Meter counts by type: online, in alarm, offline

Asset types


Facilities
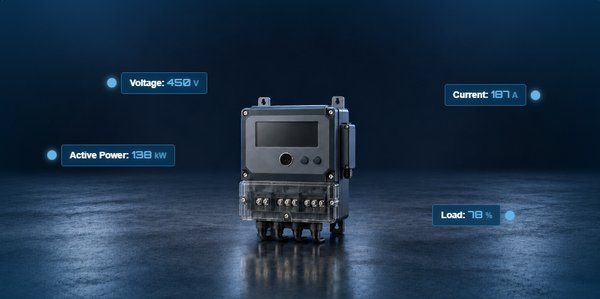
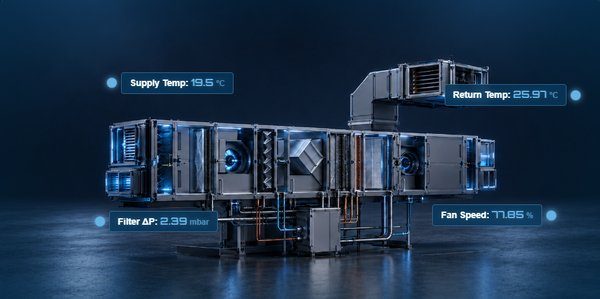
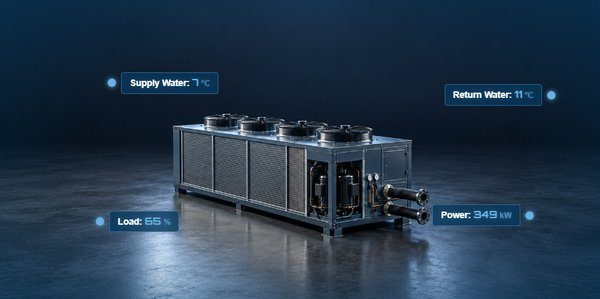
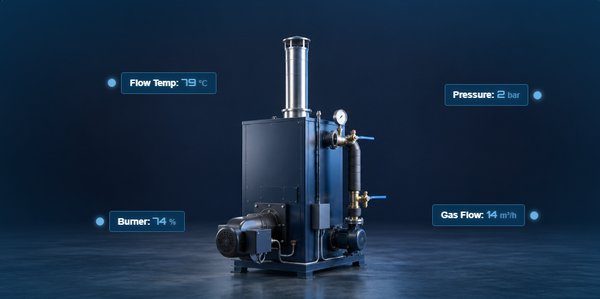
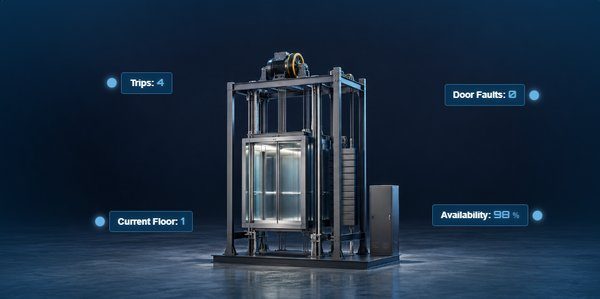
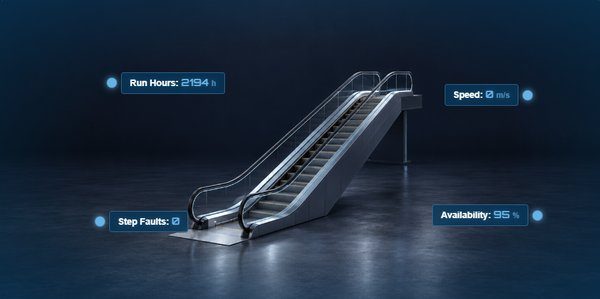
Buildings, plant rooms, lifts and escalators.
- Availability and building energy, this week and last
- Planned maintenance: done against planned
- Work orders, SLA and portfolio health
- Critical equipment, with its health score

Asset types


Safety & Security
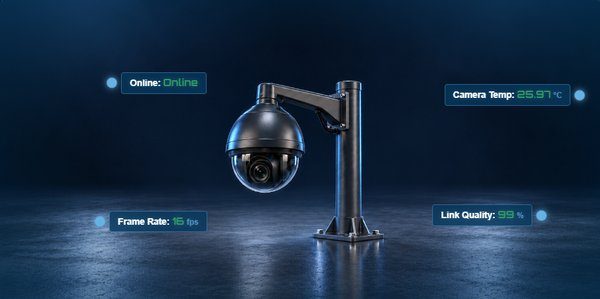
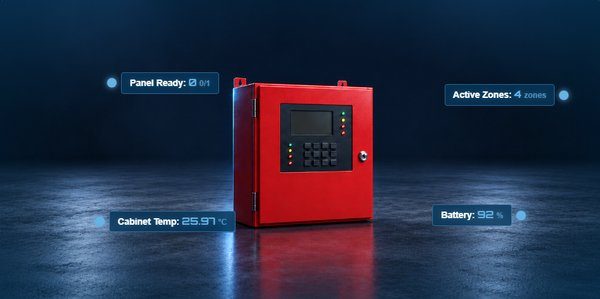
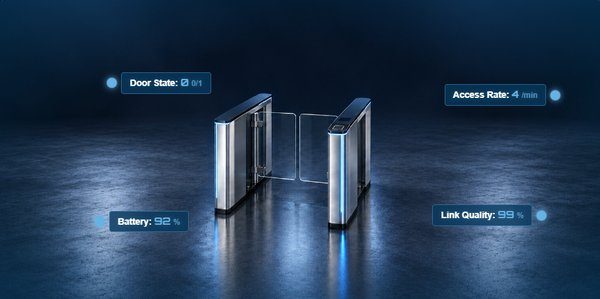
CCTV, fire alarm and access control.
- Cameras online and devices that need attention
- Fire panels: normal, alarm, fault, offline
- Doors held, forced and online
- Incidents by type, and response within SLA

Asset types


Environment
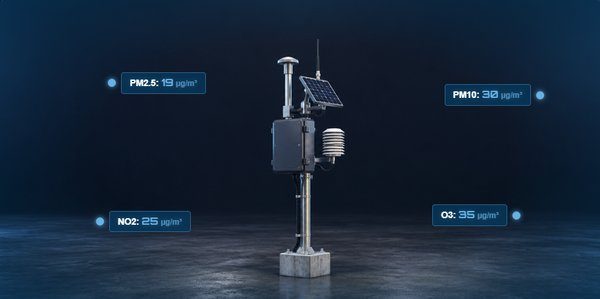
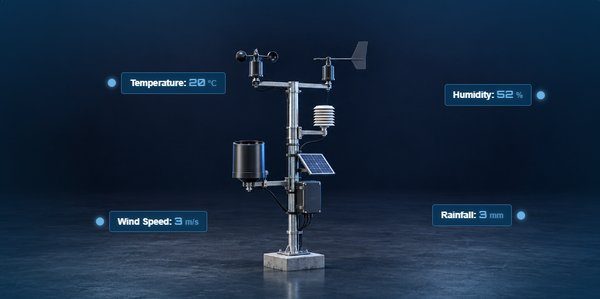
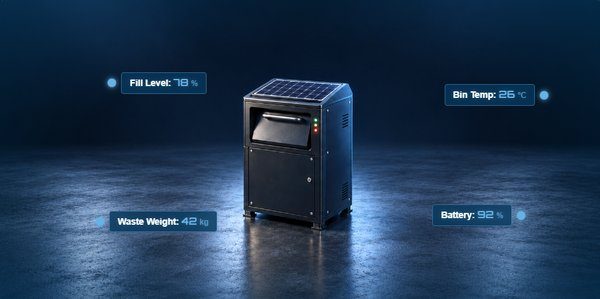
Air quality, weather and waste.
- Air quality index and PM2.5 by district
- Temperature, humidity and compliance
- Smart bins: fill level and missed collections
- Districts ranked from worst to best

Asset types


Transportation
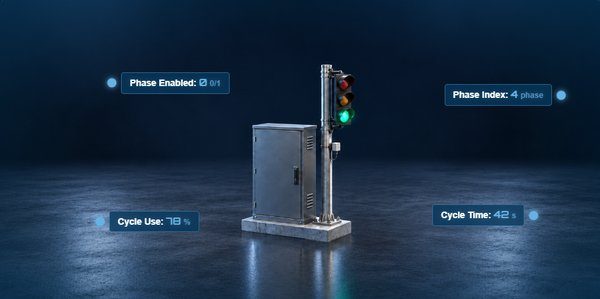
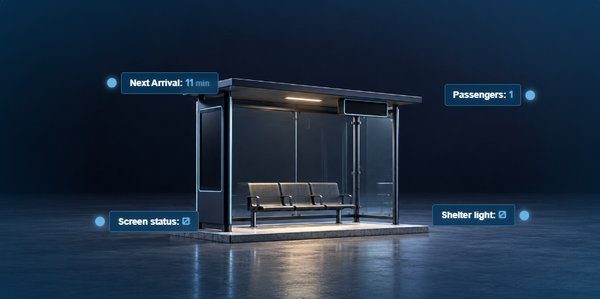
Roads, lighting, parking and public transport.
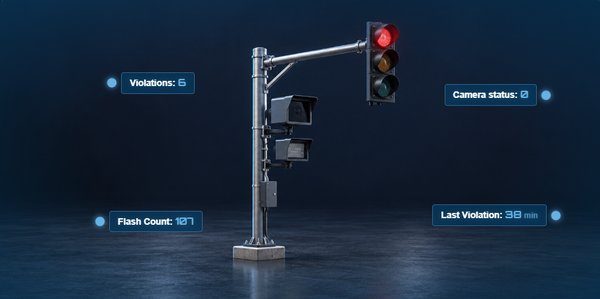
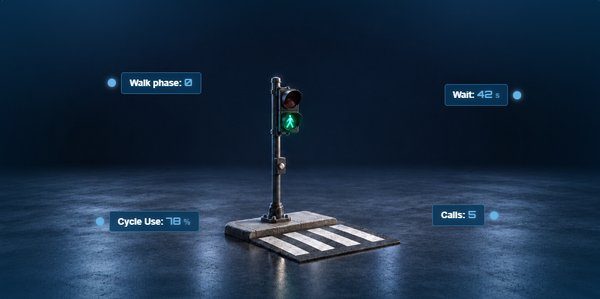
- Signal intersections online
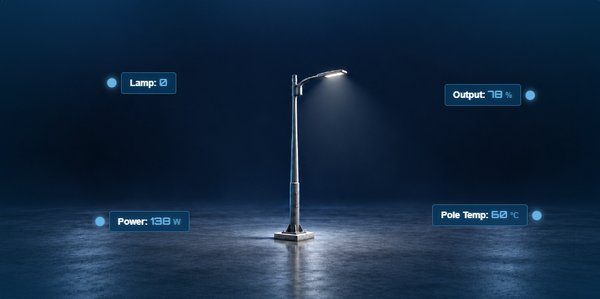
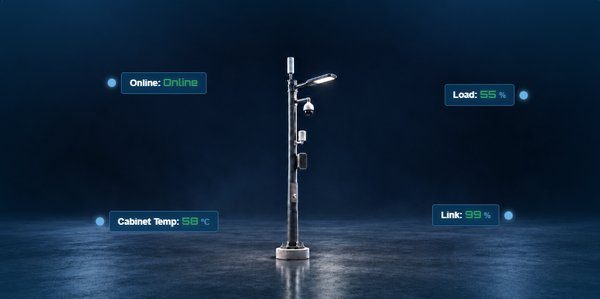
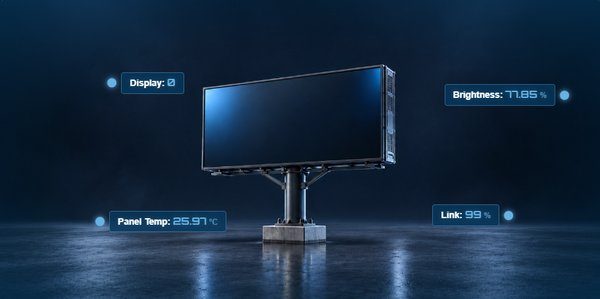
- Street lights, smart poles and signs
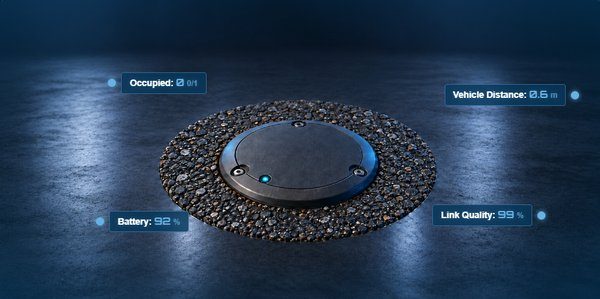
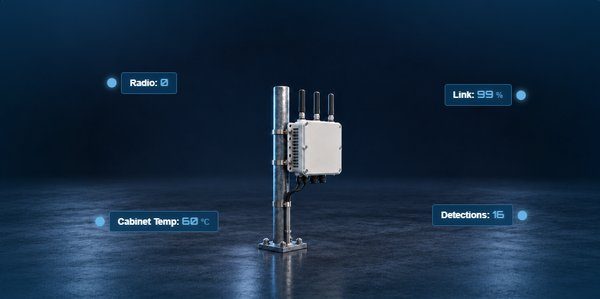
- Parking sensors and connected roadside units
- Readiness of each fleet of devices

Asset types


Drill down
From the whole city to one transformer.


GIS
Your map engine. Live assets on top.
- Esri ArcGIS
- Google Maps
- 2GIS
- 170+ offline region maps

Maps and layers
- Offline satellite, street and topographic maps, for remote or air-gapped sites
- KML, KMZ, Shapefile and GeoJSON layers, styled your way
- Searchable site tree, filters, legend and zoom-aware display
Live on the map
- A status icon for every asset, by type and state
- Zone dashboards: flow, consumption and controller health
- Geofences and zones driven by live data
- Real-time GPS tracking of moving assets
Act from the map
- KPI tiles and click-to-act automation
- Drag-and-drop asset placement, with edit and view-only modes
- Full Arabic and English
Multi-tenant
One platform. Many operators.
Give each operator in the city its own space on one shared platform.
 Stream Platform· one installation
- Own users and roles
- Own assets and data
- Own dashboards and alarms
City operations center
City-wide view, incidents and service requests
Water and power utility
Networks, stations and meters
District developer
Its buildings and district assets
Facility manager
Plant rooms, lifts and work orders
Digital Blocks
Every asset, a live twin.
One page per device. Edit the block once, and every pump in the city follows.

- Live valuesRead from the device, shown on the equipment
- Digital twinHealth, running hours, alarm count, anomalies
- Device and assetType, district, install and service dates
- ReadinessCondition, efficiency and maintenance scores
- MaintenancePreventive and corrective history, open tasks
- AlarmsFrom the device and from incidents
- TrendsAny two values over time
Asset registry
Add a device in three steps.
- AssetType, zone, name, serial number and location
- CommunicationProtocol and address: Modbus, IEC 61850, LoRaWAN and more
- Tag mappingDevice values mapped to the asset's model
Then every device shows its protocol, provisioning status and when it was last seen.

Stations and buildings
Open any station or building.
See it the way its operator does: single-line diagrams, floor plans, plant rooms and doors.


Cross-domain
One fault. Three domains. One screen.
The platform knows which feeder supplies which asset. When a kiosk breaker trips, the water and street-light impact shows on the same screen.
Kiosk K01 events · the same minute
| Time | Priority | Event |
|---|---|---|
| 13:42 | P1 | K01 transformer breaker tripped |
| 13:42 | P1 | Wastewater pump station · no supply |
| 13:42 | P1 | 20 street lights offline |
| 13:42 | P2 | Earth fault detected · Feeder 3 |
| 13:43 | P3 | K01 restored |
From the kiosk screen.

Maintenance and service
Work orders, incidents and requests, beside the live data.
Work orders
Open and overdue, by domain, with compliance.
Planned maintenance
Done against planned this month, against your target.
Incidents
Open, critical and high, by domain, with response time against SLA.
Service requests
Received today, closed on time and open, by domain.
The core
Connects straight to the field.
Drivers, historian and security are part of the platform. No separate OPC servers or IoT middleware.
Native drivers
IEC 61850, IEC 60870-5-104, DNP3, Modbus, BACnet, DLMS, MQTT, LoRaWAN and OPC UA. No third-party OPC servers.
Redundant servers
Any Stream server can run as a redundant pair.
Historian
SQL, NoSQL or a custom connector, each model with its own logging rule and retention.
Security and users
Roles, tag-level access, and Active Directory or LDAP sign-in.
Integration
REST API, OPC UA server, MQTT and Kafka, for GIS, ERP and city apps.
Edge gateways
Stream Gateway at each site: native drivers, store and forward when the link drops.
Stream Gateway ›Proven at scale
A million updates a second.
On one server. Witnessed and verified by an independent testing entity.
- 2M
- tags on one server
- 1M
- updates per second
- 51%
- peak CPU at full load
Test machine: one server, 10-core CPU (16 threads), 32 GB RAM
Cybersecurity
Certified to IEC 62443.
Every Stream product is built under a certified secure development lifecycle.
-
IEC 62443-4-1
Secure development lifecycle
How we design, build and maintain every Stream product.
Certificate CER-26-11-0001
-
IEC 62443-4-2
Security requirements for IACS components
The Stream software platform, version 5.0.
Certificate CER-26-11-0002
Architecture
From the operations center to every street.
Users
- Video wall Operations center
- Operator consoles Per domain or shared
- Web and mobile Managers and field crews
- City systems GIS, ERP, CMMS, city apps
City operations center
-
Stream Platform
Redundant server pair
- Historian SQL, NoSQL or custom
- Integration REST, OPC UA, MQTT, Kafka
Districts and sites
-
Stream Gateway
Each district, store and forward
- Utility stations RTUs over IEC 60870-5-104
- Buildings BMS, fire and access panels
Field devices
- Power Kiosks, RMUs, switchgear · IEC 61850
- Water and meters Pumps, meters · Modbus, DLMS
- Roads Signals, lights, parking · MQTT
- Environment Air, weather, bins · LoRaWAN
- Cameras and doors Health and events


Book a demo meeting.
30 minutes, online. Choose what you want to see, and we show it working on systems like yours.
- A live walkthrough of the products you pick
- Answers on drivers, integration and security
- Next steps for your project
Or write to info@streamcontrols.com